Olin Lagon: State Budget Is Not Hard To Understand. We Just Explain It Badly
Hawaiʻi’s official budget “brief” runs 163 pages. Here is the whole $20.9 billion in two pictures.
August 13, 2026 · 8 min read


About the Author

Spend just 10 minutes reading this article and looking at two charts and you’ll get a better understanding of where the State of Hawaiʻi’s budget comes from and how it is spent. In those 10 minutes, the state will have spent around $400,000. By tomorrow, that number will jump to $57 million, and by next July, it will have ballooned to $20.9 billion. The truth is, many of us have no idea where all this money comes from or where it actually goes. But if you give me those 10 minutes, I’ll show you exactly that.
The new fiscal year started on July 1. If you’re looking for information on the budget, the state has a document called the FY 2027 Executive Supplemental Budget, Budget in Brief, which can be found on budget.hawaii.gov. They call it a brief, but it’s actually 163 pages long. I didn’t have the nerve to download the full version!

Ideas showcases stories, opinion and analysis about Hawaiʻi, from the state’s sharpest thinkers, to stretch our collective thinking about a problem or an issue. Email news@civilbeat.org to submit an idea or an essay.
The people in charge of the budget could make their reports easier to understand, not just detailed. Here’s an idea … give this budget in brief to a group of people and ask them some basic questions after an hour. Questions like, how much money is in the budget, where does it come from, what are the two main things we spend it on, and are we making more money than we’re spending or less. I think most people would struggle to get even one of these questions right. The budget is a complex thing, but it’s useful if more of us understand the basics, not just the experts.
That’s not a criticism of how well we understand money matters. It’s more about how financial information is presented. The people who write these reports are experts talking to other experts.
Let’s try a different approach to understanding the budget. I was able to create these two charts in just one evening, which shows that making good charts doesn’t have to be a part time job.
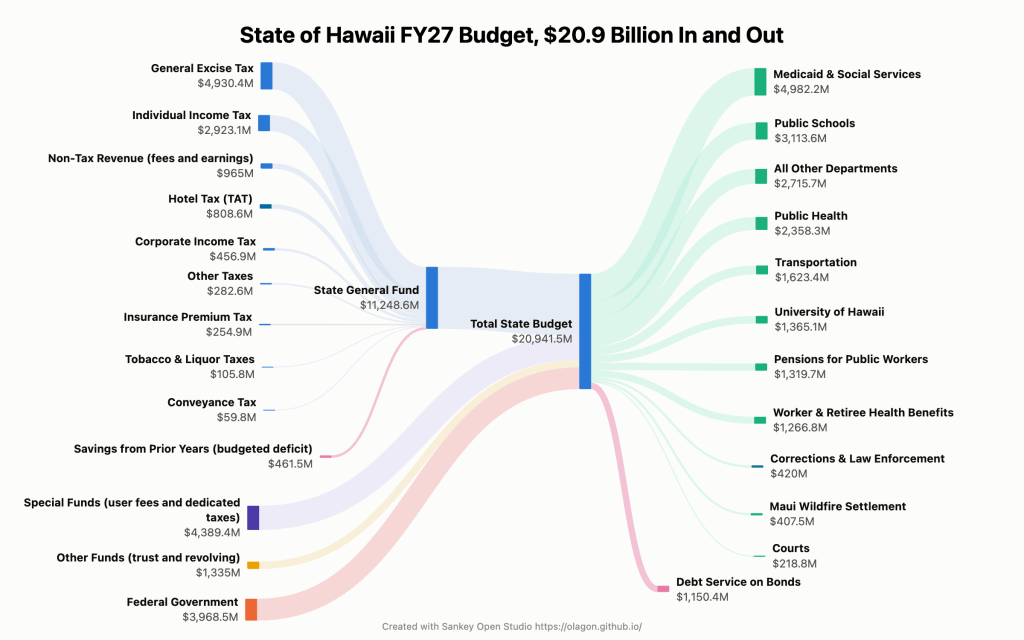
Letʻs start with the big picture. The main image above shows nearly every dollar flowing into and out of the state’s operating budget. The money comes in four big buckets.
- The general excise tax, income taxes, the hotel tax, the fees the state charges for services, and a number of smaller taxes all flow into the state general fund. Unlike the other three buckets, this money does not arrive with a purpose already attached to it.
- Special funds are user fees and dedicated taxes locked to a purpose, like airport landing fees that run the airports, fuel taxes that maintain highways, and University of Hawaiʻi tuition that stays with the university.
- Other funds are trust and revolving accounts, things like school cafeteria receipts that cycle back into cafeterias and money the state holds in trust for others.
- The federal government provides a significant amount of money, around $4 billion, which is about one-fifth of the total, mainly for Medicaid and social services.
You can see at a glance that a bit more than half of everything, $11.2 billion, moves through the state general fund.
Now look at the red ribbon labeled savings from prior years. This year the general fund does not raise enough to cover what the state plans to spend from it, and the law still requires the books to balance. Hawai’i’s constitution says general fund spending cannot exceed current revenues and unencumbered cash balances. Those fancy words —unencumbered cash balances — just mean the state can count money left over from earlier years. So the budget uses $462 million from that leftover balance to close the gap.
To be clear, the state is not running out of money. It expects to end the year with more than a billion dollars still in the general fund, and the rainy day fund holds close to $1.7 billion. But that cushion is shrinking, and it is worth noticing that we are spending more than we are taking in.
One more thing about the left side of the chart. The tax and revenue figures feeding the general fund are estimates. If the economy has a bad year they come down, and if it has a good year they go up. The state updates its official forecast in September.
The right side shows where the money gets spent. About 40% of all spending goes to just two categories, 1) Medicaid and social services, and 2) our public schools:
- Medicaid and social services covers Med-QUEST, which is mostly medical care for ʻohana and kūpuna who need kōkua. It also includes financial assistance for families in crisis, what many call welfare. A lot of our deserving keiki are fed, housed and cared for through this fund.
- We have roughly 164,000 public school students, so this budget works out to about $19,000 per student per year. The true cost runs higher, because teacher pensions, health benefits, and school construction debt live elsewhere in the budget.
All Other Departments at $2.7 billion bundles the rest of the state government, like land and natural resources, labor, economic development, agriculture, the attorney general, the tax department, and a dozen more. The red ribbon near the bottom is debt service, about $1.15 billion a year in payments on money the state borrowed in the past.
Hopefully you now have the big picture. Money comes in from four streams and gets spent on about a dozen big things. The next lesson is that those streams do not cover expenses equally. Each one has its own flow.

Take a look at this second chart. Four expenses are carried by the general fund alone. Pensions for public workers, health benefits for current workers and retirees, the Maui wildfire settlement payment, and debt service.
Most things are funded by a mix of sources. For public schools, the state provides 84 cents out of every dollar. But when it comes to Medicaid, the situation is reversed. The federal government pays 63 cents of every dollar spent on Medicaid and social services. The biggest chunk of federal funds that come into the state budget goes toward this one area.
Some areas of the budget don’t really affect the state’s main funding source. Take transportation, for example. This includes things like airports, highways and harbors. These are mostly paid for by fees and taxes that are specific to those areas, like landing fees for airports, fuel taxes for gas, and vehicle fees for cars.
Hopefully you now have a clearer picture of our state budget.
I’m not saying the state should stop making detailed budget documents, they’re necessary. What I’m asking is for those who handle public funds to add a simple chart or two, like the ones I created. Then, try testing it out the way I suggested earlier.
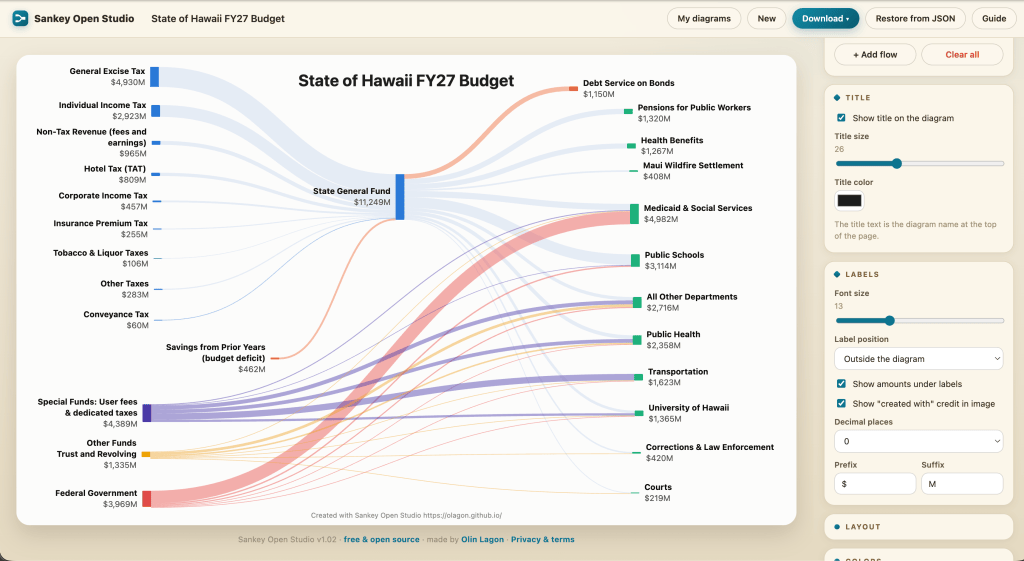
You can easily create your own Sankey diagrams. I’ve helped develop a free and open-source tool called Sankey Open Studio, which you can find at https://olagon.github.io/sankey_open_studio. This tool is convenient because it works right in your browser, and you don’t need to sign up for anything. Plus, it keeps your data safe on your own computer. To get started, all you have to do is paste in three columns of data: where the money is coming from, where it’s going, and how much it is. Try using the tool to run your organization’s numbers and see what story they tell.
Public funds are a shared kuleana, and making sense of them shouldn’t require a degree in accounting… though to be fair I do have one of those. But this article isn’t based on that training. It’s rooted in community work, in talking to people over kimchee fried rice, and trying to understand what matters to them. I’ve learned that ideas are most powerful when they’re shared in a way that lets everyone contribute their manaʻo. A budget should be a discussion that everyone can join in on.
Note for the pros: Pulling data from multiple state sources is hard. If I’ve made any mistakes, please drop a correction in the comments. Mahalo!
Sources: The revenue numbers come from a forecast made by the Council on Revenues on May 21, 2026, and from non-tax revenue tables provided by the Department of Budget and Finance, which are available on the state’s tax website. The spending figures are based on the budget that was signed into law in June 2026, specifically House Bill 1800, Act 175, as well as the Judiciary budget from House Bill 2095, Act 178, and the payment into the Maui Wildfires Settlement Trust Fund from House Bill 1001 in 2025. The state says its operating budget is around $20.3 billion. However, when we add in the costs for the courts, which are about $218.8 million, and the settlement payment of $407.5 million, we get a more complete idea of what the state is actually spending. This brings the total to more than what the state initially reports. Additionally, there’s $462 million that is being drawn from savings from the previous year, which I calculated by looking at the difference between what the general fund is set to spend and what it is expected to collect in revenue. The enrollment numbers for public schools are based on the most recent count, which is about 164,000 students for the 2025-26 school year. This information and more can be found in the FY 2027 Budget in Brief, which is available on the state’s budget website.
 Sign up for our FREE morning newsletter and face each day more informed.

Local reporting when you need it most
Support timely, accurate, independent journalism.
Honolulu Civil Beat is a nonprofit organization, and your donation helps us produce local reporting that serves all of Hawaii.
ContributeAbout the Author