
Hawaii Has A New COVID-19 Data Dashboard With New Metrics
Lawmakers and the public have been calling for better data, and the state has been promising it at least since Aug. 6.
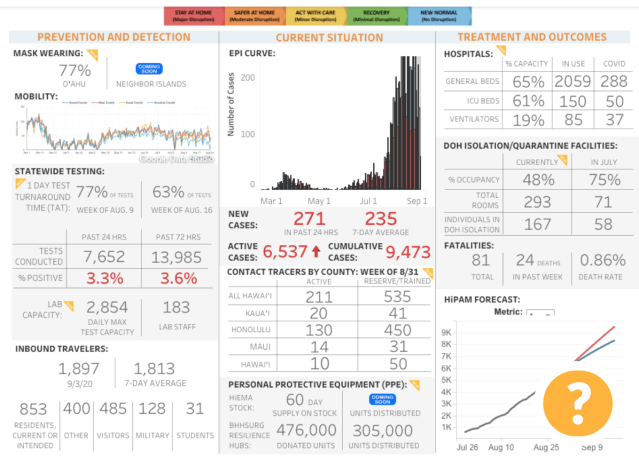
Hawaii state officials launched a new COVID-19 data dashboard Friday that provides a more comprehensive picture of how COVID-19 is affecting the islands.
The new metrics include most of what outgoing Health Director Bruce Anderson and Gov. David Ige promised almost a month ago, including figures on contact tracing, quarantine facility space, sources of exposure, and an active hospitalization count, which was formerly only provided by Lt. Gov. Josh Green, the state’s COVID-19 medical liaison.
Some metrics are still missing, such as the timeliness of case and contact interviews, which is marked with a placeholder that states “Coming soon,” but it is not clear when. That metric would reveal the percentage of people the Department of Health and partners are able to successfully contact within a day of receiving electronic laboratory reports of those diagnosed, along with how many of their contacts are contacted within 24 hours.
Other data not included are statistics on staffing levels at hospitals and information about business compliance with COVID-19 prevention rules.
Nick Redding of the Hawaii Data Collaborative said the dashboard is “fairly comprehensive,” as it includes statistics on mask wearing, transmission sources and the state’s contact tracing and testing capacity — in other words, how “effectively we are able to identify and isolate new cases early.”
“We watch so closely the new case numbers day after day, but that tells us what was happening a couple of weeks ago, in terms of behaviors and other kinds of risk factors that would increase or decrease the spread,” he said. “Now, you can see there’s a good intention and effort to track what actually leads to increases in transmission of COVID-19.”
Some of the takeaways from the new data include that more than 400 cases have been reported in communal living settings like prisons, shelters, and nursing homes, about half of 300 available state-funded quarantine rooms are currently occupied, and the state has a 60-day supply of personal protective equipment.
The dashboard also highlights hospital bed capacity with a count of how many intensive care unit beds and ventilators are in use by COVID-19 patients. The site does not include information about staffing levels, which health care officials have reported is a more pressing issue than physical bed space for Hawaii at the moment.

Amidst great public criticism of the state’s ability to hire enough contact tracers, the dashboard offers some other highly anticipated information: Now the public can track the number of contact tracers deployed to each county. Approximately 211 are actively working on contact tracing, with another 535 trained people on reserve. Most are on Oahu. Kauai has 20, Maui 14, and Hawaii island 10 contact tracers currently active.
Viewers can also get a sense for testing turnaround times and a measure of local laboratories’ collective ability to test people — as of mid-August, about 63% of test results were returned within 24 hours.
The percentage of COVID-19 tests that return positive is also included: 3.3% of 7,652 tests conducted within the past day were positive, and fewer than 4% of tests conducted within the past three days were positive. The positivity rate may be influenced by the ongoing federally-funded surge testing drive on Oahu.
More than three-quarters of Oahu residents are consistently wearing masks, data show.
For the time being, the dashboard is in a “prototype” stage and is not interactive, so users can’t click on features and explore further. However, Joint Information Center spokesman Dan Dennison said it will soon become dynamic and interactive. He did not specify exactly when.
Victoria Fan, a health researcher and professor at the University of Hawaii and member of HiPAM — the volunteer collective that aims to track COVID-19 specifically for Hawaii — called the dashboard a “work in progress” and said there are many data partners involved.
Dennison said the data will be updated either daily or weekly, depending on the source. Data and information comes from the Hawaii Data Collaborative, Hawaii Tourism Authority, the Behavioral Health and Homelessness Statewide Unified Response Group, the Hawaii Pandemic Applied Modeling Work Group and federal agencies.
It has been about a month since Anderson and Ige announced that new data would be released, after lawmakers, the public and the media called for more transparent data on the pandemic.
Hawaii has lagged behind other states in releasing COVID-19 data. A nationwide study showed that Hawaii was publishing only about 13% of essential information. State officials have continually denied data disclosures citing privacy concerns and other reasons.
Public health officials say they hope this dashboard will help tackle the pandemic in four key areas — prevention, detection, containment and treatment.
“It’s a great start,” said Thomas Lee, an epidemiologist and professor at the University of Hawaii who works with HIPAM. Lee is also the former lead COVID-19 forecaster for the Hawaii Emergency Management Agency.
Both the public and policymakers can rely upon the same information, he said.
“This is a great bridge and a great start to fill this data gap and communication issue we’ve been having,” he said. “The overall messaging is the best we’ve ever had for the state. Now the public will see the same information that the policy makers are seeing, and hopefully they’ll trust it, and when a particular policy is implemented and policymakers are citing data and trends, then there’s a consistent understanding of what’s actually going on in Hawaii.”

